Working with spreadsheets#
Spreadsheets are widely used tools for tabular data manipulation facilitating data input and allowing simple formatting, validation and visualization.
This card describes tabular data format, common mistakes made in spreadsheets and how to use your spreadsheet application effectively while increasing re-usability, quality and accuracy of your data.
What is a table (tabular data format)?#
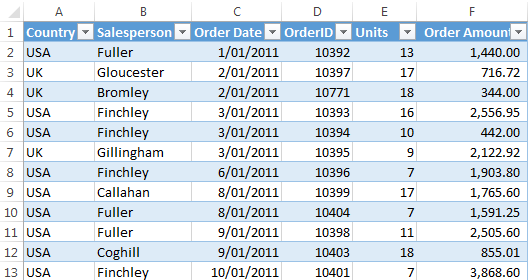
Data in tabular format follow 3 key conditions:
- table contains a one-line header containing unique machine readable column names
- table has rows representing individual observations
- table has columns representing attributes/features of the observations and contain values of one data type
| Table | Not a table |
|---|---|
 |
 |
Tips and Tricks#
Keep the original#
Changes in spreadsheets are not tracked. Any update or change should produce a new file labeled by version with changes described in change log.
Export data after collection#
For reproducibility purposes, the collected data should be always exported from proprietary (.xlsx, .xls, …) format into non-proprietary format (.csv, .tsv, etc.) with minimal metadata in README file.
Cell#
- Use field validation - validation rules on columns ensure you have data checked automatically already on input.
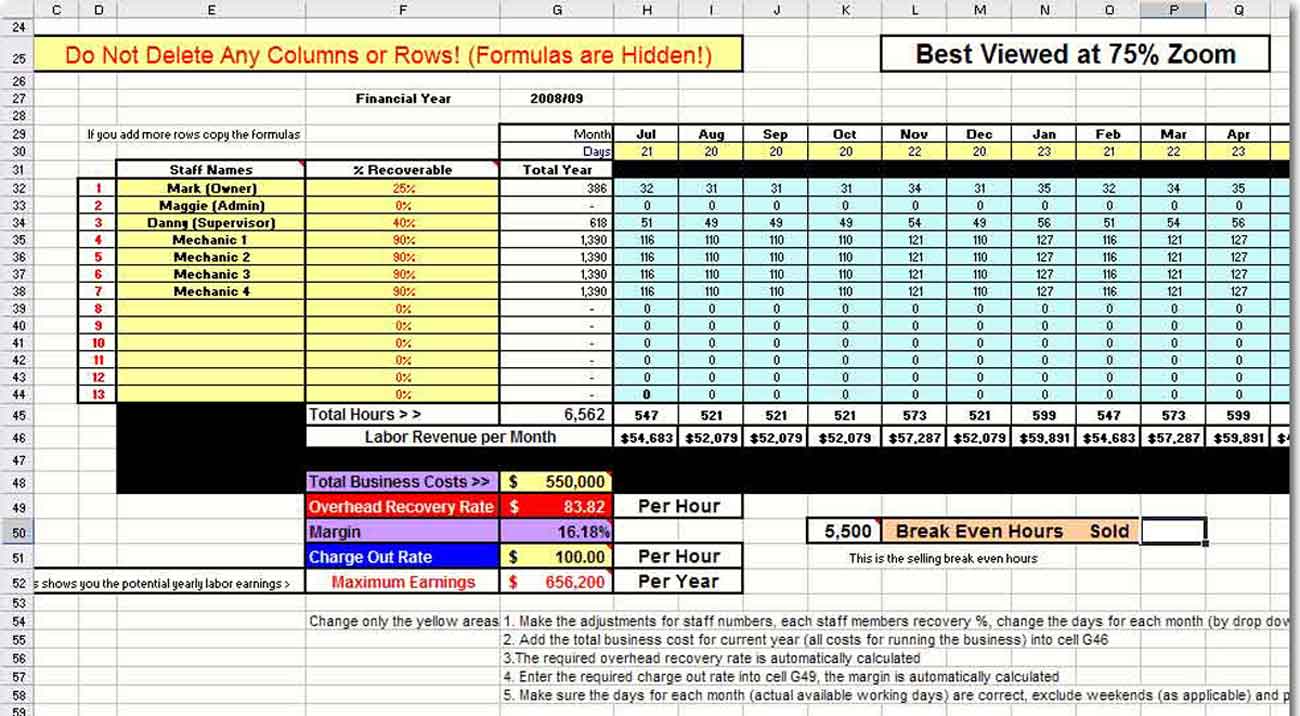
- Avoid non-exportable proprietary content - visual formatting (cell coloring / outlining), embedded comments and charts, merged cells, …
Table#
- Keep header column names machine readable. You can follow the same best practices as for file naming (see our Card on file naming).
- Keep values in columns atomic.
- Use primary keys - values in one particular column should be unique for the whole table. This will allow you to create unique references pointing to one and only one observation/record.
- Do not insert empty rows or columns which would split the table in two.
- Keep data in long format (sometimes referred to as narrow, gathered or melted format). All columns should be meaningful for all observations. If a new observation requires a new column to be created or if the observation’s data ends up in just one cell instead of the whole row, your table is most probably NOT in long format.
MS Excel Table tool#
MS Excel feature called Table (found in Insert->Table) allows to create real table object instead of just cell range. Its main advantages are:
- Table formatting and column validation is expanded automatically with a new observation/record.
- Each table object can be referenced by its name - no more (named) cell ranges and hard-to-read formulas.
- Automatically adds filter buttons and subtotals.
Sheet#
- Keep one table per sheet or workbook.
- Start your table in the first column (and preferably on the first row).
- Do not insert any values next or below your table - add the content to a new column, new table, analyses sheet or file with metadata.
- Keep metadata about the table in separate sheet in tabular format or separate file. If you must, keep metadata above the table itself.
Analyses#
- Keep data separate from the analyses - create a link to the data from sheets or workbooks containing the analyses.
- Use pivot tables - if your data is in long format (it should be), it is very easy to create dynamic summary tables.
- Use pivot charts - you can produce your desired auto-refreshing charts while having data still in long format.
- Script more advanced analyses and data manipulation using standard tools for data processing (R, Python, Bash, …).
Further reading#
Data Curation Network - Microsoft Excel Data Curation Primer
Data Carpentry - Spreadsheet ecology lesson
Wikipedia - Wide and narrow data